ParaGraph: Tips and Tricks
After downloading and running ParaGraph for the first time, you might be a little puzzled about how to get started. Below are some good tips you should know in order to make things easy for you.
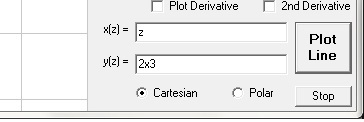
The bottom right corner of the window.
Since ParaGraph is a parametric grapher, both x and y are functions of a third variable: z. Therefore, if you're always plotting y as a function of x, which is what you want most of the time, you will always need to type a 'z' in the x(z) box. In the picture above, '2x3' is typed into the y(z) box. When you click "Plot Line" (or press the enter key), ParaGraph will convert '2x3' into '2*z^3', since it recognizes that you probably meant 'z' instead of 'x', and that you also probably want a times (*) sign and an exponent sign (^) to go there as well. The function is plotted below.
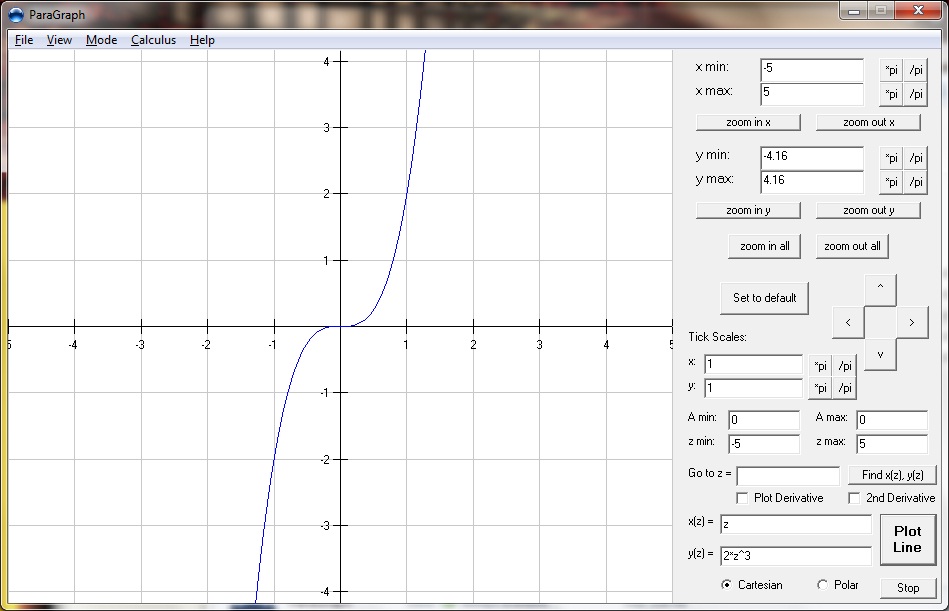
f(x) = 2x^3 (click to enlarge).
If you ever get sick of typing a 'z' into the x(z) box, follow these steps:
- Close and reopen ParaGraph (to reset the settings).
- Type 'z' in the x(z) box.
- In the menu options, click on File, then on Create Initialize File and confirm your choice. Now, when you start ParaGraph again, you'll have that 'z' in the box.
- You can do this for any settings that ParaGraph has.
Other tips:
- One easy way to zoom in is to use the zoom box. Hold down the right mouse button anywhere on the plotting area and drag the mouse. A green box will appear. When you release the mouse, the graph will zoom into the region defined by that box. Note, if you want to get rid of the green box without zooming in, left click the mouse before letting the right mouse button go.
- If you get "lost" in your graphing window, just click the "Set to default" button to reset your viewing range.
- Only change your "A min" and "A max" text boxes if you plan on using an animation. ParaGraph will increment your A value by a little bit over time to produce an animation. For example, to animate a growing amplitude of a sine curve, y(z) = A*sin(z) with A = 0 to 2 would show a sine curve with an amplitude of 0 growing to an amplitude of 2.
- ParaGraph finds intersection of lines by comparing the function that is entered in the main graphing page with those in the function lists. Those in the function lists are not compared with each other.
- In calculator mode, the check box called "Calculate from history box" lets you make a calculation by pressing the ENTER key when your cursor is in the history box. The line your cursor is on is the line that will be evaluated.